Iridescent Liquidity Prism [JOAT]Iridescent Liquidity Prism | Peer Momentum HUD
A multi-layered order-flow indicator that combines microstructure analysis, smart-money footprint detection, and intermarket momentum signals. The script uses dynamic color-shifting themes to visualize liquidity patterns, structure, and peer momentum data directly on the chart.
There is so much to choose from inside the settings, if you think it's a mess on the chart it's because you have to personally customize it based on your needs...
Core Functionality
The indicator calculates and displays several analytical layers simultaneously:
Order-Flow Imbalance (OFI): Calculates buy vs. sell volume pressure using volume-weighted price distribution within each bar. Uses an EMA filter (default: 55 periods) to smooth the signal. Values are normalized using standard deviation to identify significant imbalances.
Smart Money Footprints: Detects accumulation and distribution zones by comparing volume rate of change (ROC) against price ROC. When volume ROC exceeds a threshold (default: 65%) and price ROC is positive, accumulation is detected. When volume ROC is high but price ROC is negative, distribution is detected.
Fractal Structure Mapping: Identifies pivot highs and lows using a fractal detection algorithm (default: 5-bar period). Maintains a rolling window of recent structure points (default: 4 levels) and draws connecting lines to show trend structure.
Fair Value Gap (FVG) Detection: Automatically detects price gaps where three consecutive candles create an imbalance. Bullish FVGs occur when the current low exceeds the high two bars ago. Bearish FVGs occur when the current high is below the low two bars ago. Gaps persist for a configurable duration (default: 320 bars) and fade when price fills the gap.
Liquidity Void Detection: Identifies candles where the high-low range exceeds an ATR threshold (default: 1.7x ATR) while volume is below average (default: 65% of 20-bar average). These conditions suggest areas where liquidity may be thin.
Price/Volume Divergence: Uses linear regression to detect when price trend direction disagrees with volume trend direction. A divergence alert appears when price is trending up while volume is trending down, or vice versa.
Peer Momentum Heatmap (PMH): Calculates composite momentum scores for up to 6 symbols across 4 timeframes. Each score combines RSI (default: 14 periods) and StochRSI (default: 14 periods, 3-bar smooth) to create a momentum composite between -1 and +1. The highest absolute momentum score across all combinations is displayed in the HUD.
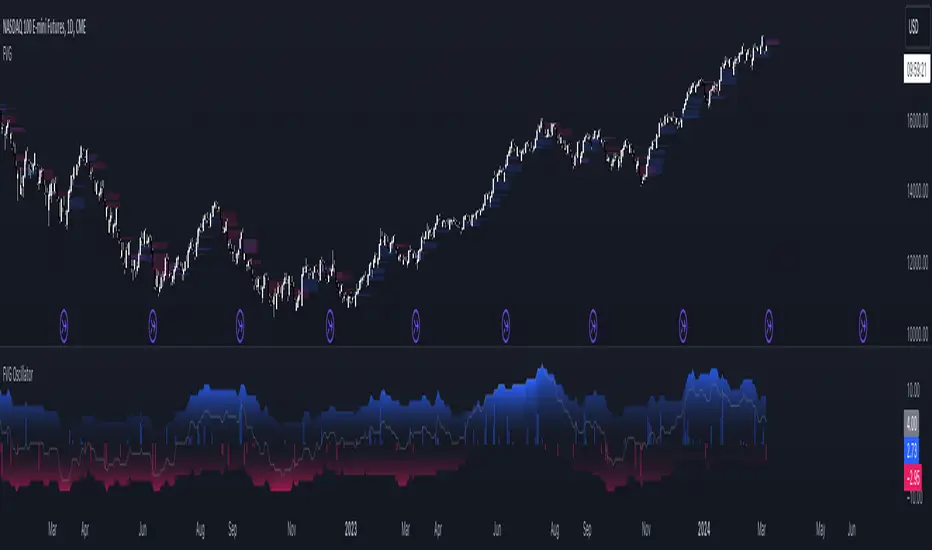
Custom settings using Fractal Pivots, Skeleton Structure, Pulse Liquidity Voids, Bottom Colorful HeatMaps, and Iridescent Field.
---
Visual Components
Spectrum Aura Glow: ATR-weighted bands (default: 0.25x ATR) that expand and contract around price action, indicating volatility conditions. The thickness adapts to market volatility.
Chromatic Flow Trail: A blended line combining EMA and WMA of price (default: 8-period EMA blended with WMA at 65% ratio). The trail uses gradient colors that shift based on a phase oscillator, creating an iridescent effect.
Volume Heat Projection: Creates horizontal volume profile bands at price levels (default: 14 levels). Scans recent bars (default: 150 bars) to calculate volume concentration. Each level is colored based on its volume density relative to the maximum volume level.
Structure Skeleton: Dashed lines connecting fractal pivot points. Uses two layers: a primary line (2-3px width) and an optional glow overlay (4-5px width) for enhanced visibility.
Fractal Markers: Diamond shapes placed at pivot high and low points. Color-coded: primary color for highs, secondary color for lows.
Iridescent Color Themes: Five color themes available: Iridescent (default), Pearlescent, Prismatic, ColorShift, and Metallic. Colors shift dynamically using a phase oscillator that cycles through the color spectrum based on bar index and a speed multiplier (default: 0.35).
---
HUD Console Metrics
The right-side HUD displays seven key metrics:
Flow: Shows OFI status: ▲ FLOW BUY when normalized OFI exceeds imbalance threshold (default: 2.2), ▼ FLOW SELL when below -2.2, or ◆ FLOW BAL when balanced.
Struct: Structure trend bias: ▲ STRUCT BULL when microtrend > 2, ▼ STRUCT BEAR when < -2, or ◆ STRUCT RANGE when neutral.
Smart$: Institutional activity: ◈ ACCUM when smart money index = 1, ◈ DISTRIB when = -1, or ○ IDLE when inactive.
Liquid: Liquidity state: ⚡ VOID when a liquidity void is detected, or ● NORMAL otherwise.
Diverg: Divergence status: ⚠ ALERT when price/volume divergence detected, or ✓ CLEAR when aligned.
PMH: Peer Momentum Heatmap status: Shows dominant timeframe and momentum score. Displays 🪩 for bull surge (above 0.55 threshold) or 🧨 for bear surge (below -0.55).
FVG: Fair Value Gap status: Shows active gap count or CLEAR when no gaps exist. Displays GAP LONG when bullish gap detected, GAP SHORT when bearish gap detected.
Pearlscent Color with Volume Heatmap.
Parameters and Settings
Microstructure Engine:
Analysis Depth: 20-250 bars (default: 55) - Controls OFI smoothing period
Liquidity Threshold ATR: 1.0-4.0 (default: 1.7) - Multiplier for void detection
Imbalance Ratio: 1.5-6.0 (default: 2.2) - Standard deviations for OFI significance
Smart Money Layer:
Smart Money Window: 10-150 bars (default: 24) - Period for ROC calculations
Accumulation Threshold: 40-95% (default: 65%) - Volume ROC threshold
Structural Mapping:
Fractal Pivot Period: 3-15 bars (default: 5) - Period for pivot detection
Structure Memory: 2-8 levels (default: 4) - Number of structure points to track
Volume Heat Projection:
Heat Map Lookback: 60-400 bars (default: 150) - Bars to analyze for volume profile
Heat Map Levels: 5-30 levels (default: 14) - Number of price level bands
Heat Map Opacity: 40-100% (default: 92%) - Transparency of heat map boxes
Heat Map Width Limit: 6-80 bars (default: 26) - Maximum width of heat map boxes
Heat Map Visibility Threshold: 0.0-0.5 (default: 0.08) - Minimum density to display
Iridescent Enhancements:
Visual Theme: Iridescent, Pearlescent, Prismatic, ColorShift, or Metallic
Color Shift Speed: 0.05-1.00 (default: 0.35) - Speed of color phase oscillation
Aura Thickness (ATR): 0.05-1.0 (default: 0.25) - Multiplier for aura band width
Chromatic Trail Length: 2-50 bars (default: 8) - Period for trail calculation
Trail Blend Ratio: 0.1-0.95 (default: 0.65) - EMA/WMA blend percentage
FVG Persistence: 50-600 bars (default: 320) - Bars to keep FVG boxes active
Max Active FVG Boxes: 10-200 (default: 40) - Maximum boxes on chart
FVG Base Opacity: 20-95% (default: 80%) - Transparency of FVG boxes
Peer Momentum Heatmap:
Peer Symbols: Comma-separated list of up to 6 symbols (e.g., "BTCUSD,ETHUSD")
Peer Timeframes: Comma-separated list of up to 4 timeframes (default: "60,240,D")
PMH RSI Length: 5-50 periods (default: 14)
PMH StochRSI Length: 5-50 periods (default: 14)
PMH StochRSI Smooth: 1-10 periods (default: 3)
Super Momentum Threshold: 0.2-0.95 (default: 0.55) - Threshold for surge detection
Clarity & Readability:
Liquidity Void Opacity: 5-90% (default: 30%)
Smart Money Footprint Opacity: 5-90% (default: 35%)
HUD Background Opacity: 40-95% (default: 70%)
Iridescent Field:
Field Opacity: 20-100% (default: 86%) - Background color intensity
Field Smooth Length: 10-200 bars (default: 34) - Smoothing for background gradient
---
Alerts
The indicator provides seven alert conditions:
Liquidity Void Detected - Triggers when void conditions are met
Strong Order Flow - Triggers when normalized OFI exceeds imbalance ratio
Smart Money Activity - Triggers when accumulation or distribution detected
Price/Volume Divergence - Triggers when divergence conditions occur
Structure Shift - Triggers when structure polarity changes significantly
PMH Bull Surge - Triggers when PMH exceeds positive threshold (if enabled)
PMH Bear Surge - Triggers when PMH exceeds negative threshold (if enabled)
Bull/Bear Prismatic FVG - Triggers when new FVG is detected (if FVG display enabled)
---
Usage Considerations
Performance may vary on lower timeframes due to the volume heat map calculations scanning multiple bars. Consider reducing heat map lookback or levels if experiencing slowdowns.
The PMH feature requires data requests to other symbols/timeframes, which may impact performance. Limit the number of peer symbols and timeframes for optimal performance.
FVG boxes automatically expire after the persistence period to prevent chart clutter. The maximum box limit (default: 40) prevents excessive memory usage.
Color themes affect all visual elements. Choose a theme that provides good contrast with your chart background.
The indicator is designed for overlay display. All visual elements are positioned relative to price action.
Structure lines are drawn dynamically as new pivots form. On fast-moving markets, structure may update frequently.
Volume calculations assume typical volume data availability. Symbols without volume may show incomplete data for volume-dependent features.
---
Technical Notes
Built on Pine Script v6 with dynamic request capability for PMH functionality.
Uses exponential moving averages (EMA) and weighted moving averages (WMA) for trail calculations to balance responsiveness and smoothness.
Volume profile calculation uses price level buckets. Higher levels provide finer granularity but require more computation.
Iridescent color engine uses a phase oscillator with sine wave calculations for smooth color transitions.
Box management includes automatic cleanup of expired boxes to maintain performance.
All visual elements use color gradients and transparency for smooth blending with price action.
---
Customization Examples
Intraday Scalping Setup:
Analysis Depth: 30 bars
Heat Map Lookback: 100 bars
FVG Persistence: 150 bars
PMH Window: 15 bars
Fast color shift speed: 0.5+
Macro Structure Tracking:
Analysis Depth: 100+ bars
Heat Map Lookback: 300+ bars
FVG Persistence: 500+ bars
Structure Memory: 6-8 levels
Slower color shift speed: 0.2
---
Limitations
Volume heat map calculations may be computationally intensive on lower timeframes with high lookback values.
PMH requires valid symbol names and accessible timeframes. Invalid symbols or timeframes will return no data.
FVG detection requires at least 3 bars of history. Early bars may not show FVG boxes.
Structure lines connect points but do not predict future structure. They reflect historical pivot relationships.
Color themes are aesthetic choices and do not affect calculation logic.
The indicator does not provide trading signals. All visual elements are analytical tools that require interpretation in context of market conditions.
Open Source
This indicator is open source and available for modification and distribution. The code is published with Pine Script v6 compliance. Users are free to customize parameters, modify calculations, and adapt the visual elements to their trading needs.
For questions, suggestions, or anything please talk to me in private messages or comments below!
Would love to help!
- officialjackofalltrades
อินดิเคเตอร์ Pine Script®